Tips & Insights provides advice on and examples of technology used to simplify and streamline IR activities, as well as real world examples of visual displays of data (e.g., charts, graphs, maps, tables, pictures). These eAIR features are developed by members.
-
Creating Quick, Easy, and Cheap Video Tutorials for Data Consumers
Eight years ago, the Association of Schools and Programs of Public Health (ASPPH) launched on online system of annual reporting and analytics for our member graduate schools and programs. Members were eager to stop repor...Read Moreabout: Creating Quick, Easy, and Cheap Video Tutorials for Data Consumers -
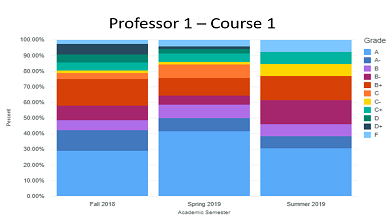
Grades Analysis Dashboard: Grades Inflation - Hype or Reality?
Founded in 1919, AUC is a leading English-language, American-accredited institution of higher education and center of intellectual, social, and cultural life of the Arab world. Its community of students, parents, faculty...Read Moreabout: Grades Analysis Dashboard: Grades Inflation - Hype or Reality? -
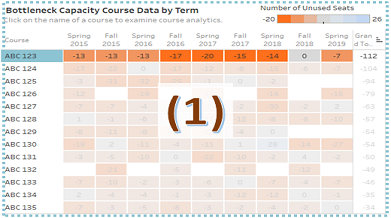
Bottleneck Capacity Courses Dashboard
Humboldt State University (HSU) is one of 23 campuses in the nation’s largest four-year university system, the California State University (CSU) system. The CSU Chancellor’s Office has broadly described a bot...Read Moreabout: Bottleneck Capacity Courses Dashboard -
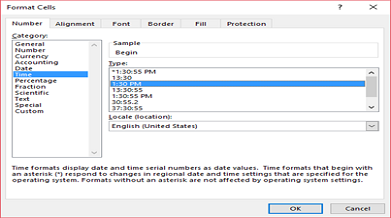
Using the Excel Time Function
I have been working on planning a conference for an organization and need to create a daily agenda. In the past, this task would be achieved by using some combination of cutting, pasting, and filling within Excel. Recent...Read Moreabout: Using the Excel Time Function -
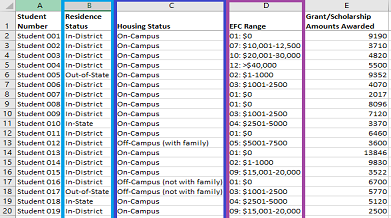
Excel MEDIAN IF Array Formula
A MEDIAN IF array formula in Excel will identify the middle number of values that meet certain criteria. An array formula performs an operation on multiple values instead of a single value. In this array formula, we esse...Read Moreabout: Excel MEDIAN IF Array Formula