-
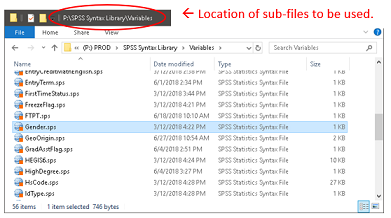
Using the INSERT Command in SPSS Syntax
There are usually some of the same variables (gender, birthdate, etc.) included in multiple data files that your office collects or maintains. Instead of duplicating the syntax in the syntax file for each data file, a sm...Read Moreabout: Using the INSERT Command in SPSS Syntax -
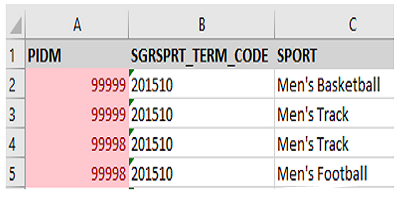
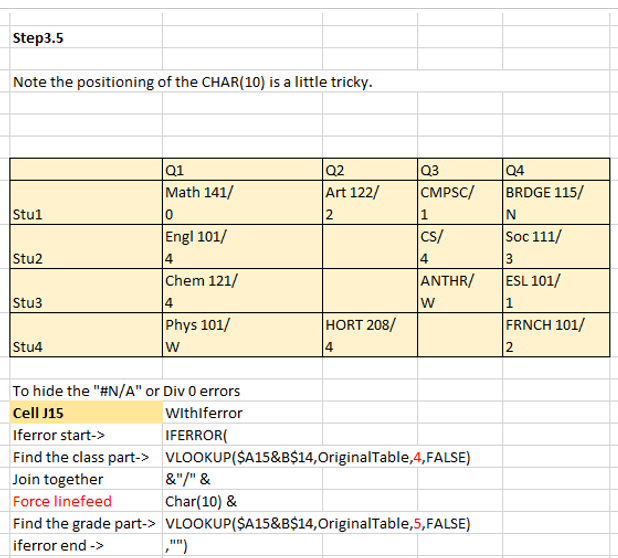
Using the Listagg Function in SQL
Our institutional research analysts frequently extract data and modify the structure of data using SQL to suit the needs of data consumers or to ease analysis. Often, we need to aggregate tables containing multiple rows ...Read Moreabout: Using the Listagg Function in SQL -
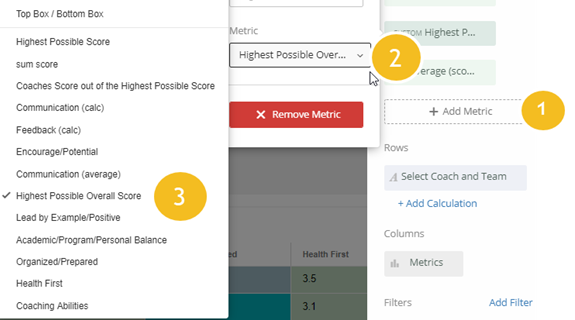
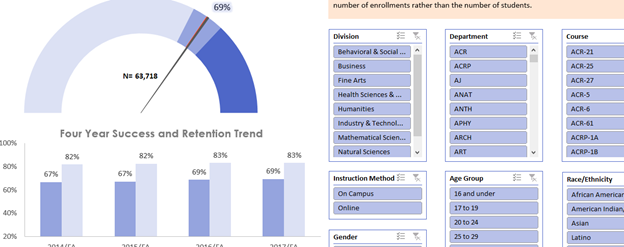
Embedding Deeper Insights into Qualtrics Dashboard
As data scientists and university employees we cannot underestimate the value of extra time. Having said that, we also understand the importance and value behind spending time discovering data and communicating its insig...Read Moreabout: Embedding Deeper Insights into Qualtrics Dashboard -
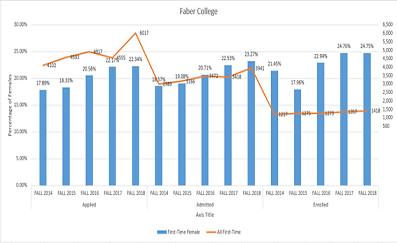
Combination Charts in Excel Made Easy
Given that a picture is worth 1,000 words, there will be occasions when you want to make your data visualization show more than just a standard chart. Microsoft Excel offers an easy way to address this by producing a com...Read Moreabout: Combination Charts in Excel Made Easy -
Embedded Data: Dynamic Survey Questions in Qualtrics
Surveys in higher education often target students at different levels of their degrees, which makes survey design tricky. Qualtrics has a useful feature to dynamically adapt survey questions to meet the survey requireme...Read Moreabout: Embedded Data: Dynamic Survey Questions in Qualtrics -

Changing Tableau’s Repository Location
When you download Tableau Desktop, by default Tableau adds a file folder to your documents folder called “My Tableau Repository.” This folder contains data and options for your desktop application. In additio...Read Moreabout: Changing Tableau’s Repository Location -

Replacing All Links in a Word Document
Preparing documents for an accreditation visit can be a stressful task. It involves many people and lots of last minute edits. Your institution may have thought ahead and prepared a website or intranet site where the ind...Read Moreabout: Replacing All Links in a Word Document -
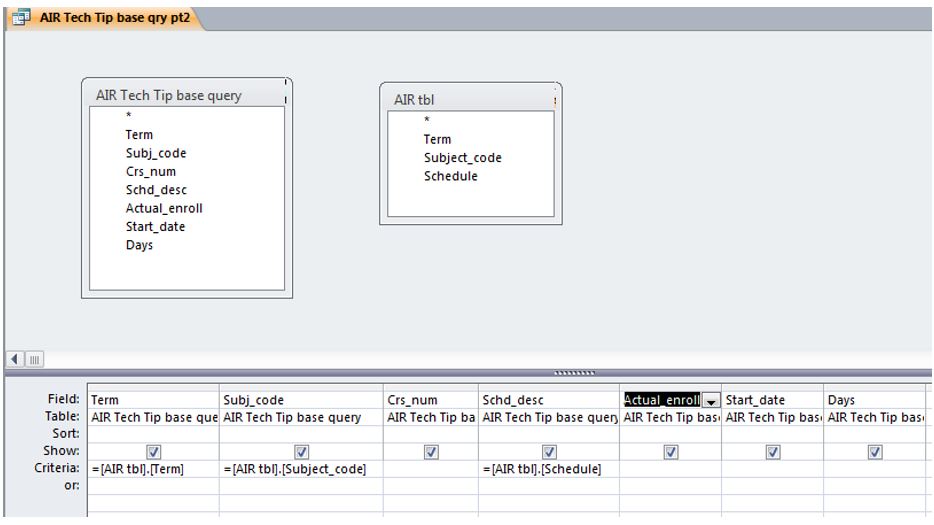
Using the Criteria Field in Microsoft Access
Many of us use Microsoft Access to extract data from Banner or other enterprise systems, or to store data that doesn’t fit in our enterprise system. This tip provides an overview of the criteria field in Access que...Read Moreabout: Using the Criteria Field in Microsoft Access -
Tip for Tableau Users
Analysts use visualizations to deliver complicated information in an easy to understand way. Dual axis function in Tableau helps users to be efficient with a message of visualization. Another name for a chart with a dual...Read Moreabout: Tip for Tableau Users -
Creating a Clear Slicer Button in Excel
Scenario: You are developing an Excel dashboard based off a Pivot table or tables and you have multiple slicers to allow different combinations of data disaggregation, as in the image below. Everyone oohs and ahs un...Read Moreabout: Creating a Clear Slicer Button in Excel -
Automating Surveys with Python, Qualtrics API, & Windows Task Scheduler
Last fall, I had the opportunity to present my survey automation project using Python and Qualtrics at the Pacific Northwest Association for Institutional Research and Planning (PNAIRP). With my friend, we have since tur...Read Moreabout: Automating Surveys with Python, Qualtrics API, & Windows Task Scheduler -
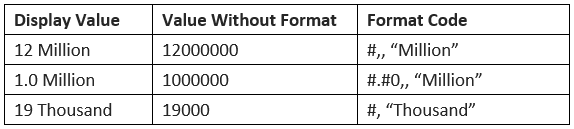
Formatting Numeric Data to “Millions” in Excel
When we report large numbers (especially related to financials), the default number formatting in Excel does not show up nicely in tables or charts, making it hard to read in a glance. One way to address this is to use c...Read Moreabout: Formatting Numeric Data to “Millions” in Excel -
Pivot Tables, VLOOKUP, and Absolute/Relative Formula References
Learn how to make Pivot Tables, VLOOKUP, and absolute/relative formula references work harder. I’m sure we’ve all been faced with the need to create a quick analysis/fishing expedition of some sort, and the ...Read Moreabout: Pivot Tables, VLOOKUP, and Absolute/Relative Formula References