
-

Identifying Low-Effort Survey Responses: A Guide and App
Survey data impacts some of the most important decisions in higher education, with institutions relying on it to accurately capture the voices of their community. While many IR/IE offices are well aware of challenges in ...Read Moreabout: Identifying Low-Effort Survey Responses: A Guide and App -
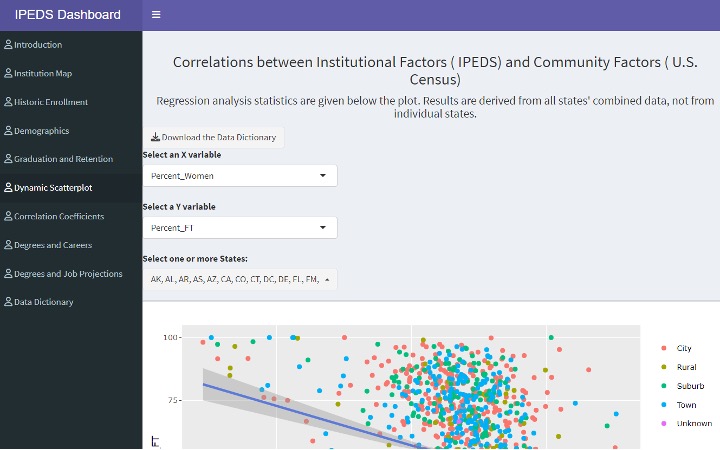
A Three-part Series on the Application and Production of Shiny Applications for IR: Part 3
This is the third and final part (see Part 1 and Part 2) of a three-part tutorial on why and how to adopt Shiny applications for IR offices. In this section, we will build on the main components introduced in the p...Read Moreabout: A Three-part Series on the Application and Production of Shiny Applications for IR: Part 3 -
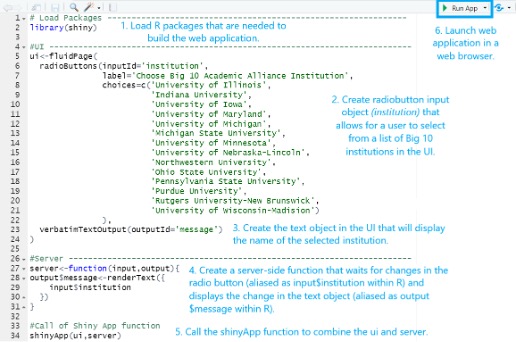
A Three-part Series on the Application and Production of Shiny Applications for IR: Part 2
This is the Part 2 (see Part 1 and Part 3) of a three-part tutorial on why and how to adopt Shiny applications for IR offices. In this section, we will introduce the main components of a Shiny app and provide some exampl...Read Moreabout: A Three-part Series on the Application and Production of Shiny Applications for IR: Part 2 -
A Three-part Series on the Application and Production of Shiny Applications for IR: Part 1
This is Part 1 of a three-part series (see Part 2 and Part 3) that provides a friendly introduction to Shiny for institutional research (IR) professionals through examples and references to available learning resour...Read Moreabout: A Three-part Series on the Application and Production of Shiny Applications for IR: Part 1 -

Using HTML Widgets for R to Create Interactive Reports
Institutional researchers are often tasked with synthesizing large amounts of data, perhaps by visualizing it in charts or summarizing it in tabular format. Allowing users to interact with these charts or tables by sorti...Read Moreabout: Using HTML Widgets for R to Create Interactive Reports -
Five Steps to Standardizing IPEDS Data Access at Your Institution
IntroductionThis eAIR Tech Tip provides advice for institutional researchers who utilize Integrated Postsecondary Education Data System (IPEDS) data for benchmarking, look-back, market, and similar landscape analyses. Wi...Read Moreabout: Five Steps to Standardizing IPEDS Data Access at Your Institution -
Building Higher Education Comparison Groups: A Data Science Informed Approach
Distance measures are an important component of many techniques found used throughout data science. Distance measures are any measure that can help us quantify the distance between two points in any given coordinate syst...Read Moreabout: Building Higher Education Comparison Groups: A Data Science Informed Approach -
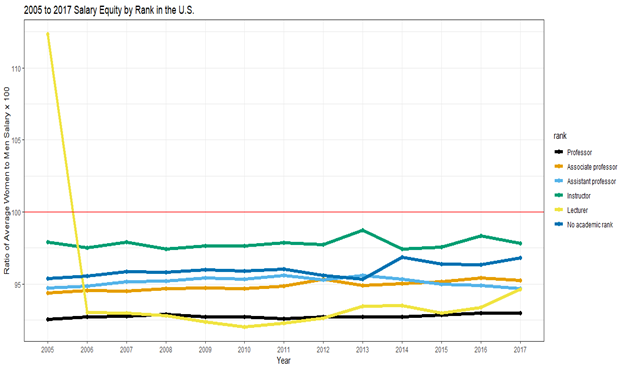
Analyzing National Salary Equity in R with Tidyverse
The tidyverse is a set of tools in the programming language, R, for data wrangling, modelling, and visualization. There are a number of functions that allow data to be “read in” from multiple formats, transfo...Read Moreabout: Analyzing National Salary Equity in R with Tidyverse -
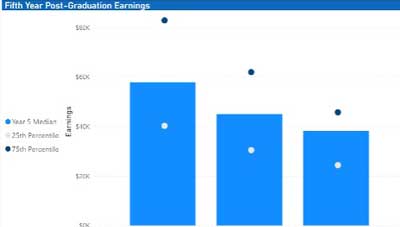
Seeing Is Believing: Using Power BI to Visualize Alumni Earnings
As higher education institutions continue to recover from challenges presented by the pandemic, they are forced to grapple with persistent nationwide enrollment declines as well as student perceptions regarding the value...Read Moreabout: Seeing Is Believing: Using Power BI to Visualize Alumni Earnings -

The Versatility of the XLOOKUP
LOOKUP, launched in 2019 by Microsoft, combines the functionality of multiple functions, including VLOOKUP and HLOOKUP, into a single source. It also offers the option to select a customized variable if no data are retur...Read Moreabout: The Versatility of the XLOOKUP -
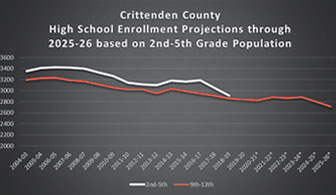
Walking Through an Enrollment Forecasting Example
A key development in higher education over the past several decades is the growth of institutional research offices that function under the core principles of explaining what is happening now and attempting to shed light...Read Moreabout: Walking Through an Enrollment Forecasting Example -
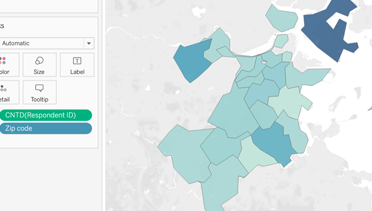
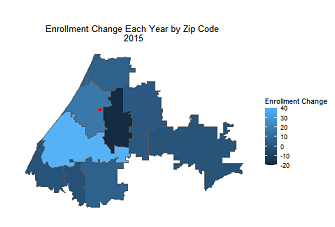
Mapping in Tableau
Visualizing geographic information helps data consumers quickly and easily derive insights and meaning. Institutional researchers, for example, may want to map students' home states or countries to help campus administra...Read Moreabout: Mapping in Tableau -

Come on and Zoom! 15 Time- and Reputation-Saving Zoom Hacks
“I have a Zoom call at 3, so make sure you only enter my office if it is an emergency AND you are fully dressed.” A little less than a year ago, at the beginning of the pandemic, when people were talking a...Read Moreabout: Come on and Zoom! 15 Time- and Reputation-Saving Zoom Hacks -

Combining Data from Multiple Sources Using R
Gathering the Data A common request of our institutional research office is to combine data from multiple sources and varying formats. For example, we keep our demographic and academic information about our students in a...Read Moreabout: Combining Data from Multiple Sources Using R -
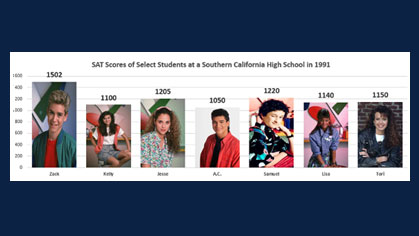
Using Images as Data Points in Excel Column Charts
There are many features in Microsoft Excel that go unnoticed. One of these features allows you to add flair to your data visualization with relative ease. When creating column charts in Excel, we often utilize the defaul...Read Moreabout: Using Images as Data Points in Excel Column Charts -

“Ctrl” Excel and Word
Did you know there are many keyboard shortcuts built into Microsoft Office that can save you time and make your life easier? It’s time to get friendly with your Control key! Here are 25 “Ctrl&n...Read Moreabout: “Ctrl” Excel and Word -
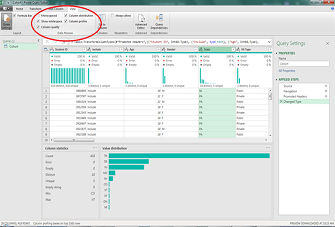
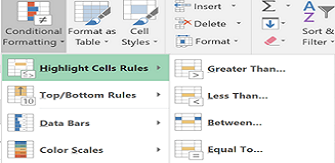
Exploring Data Using Excel’s Power Query Editor
While I primarily use Microsoft Excel’s Power Query Editor to put together a complicated table or report in a short period of time, I’ve learned that you can also use it to explore any data set. Here are the ...Read Moreabout: Exploring Data Using Excel’s Power Query Editor -
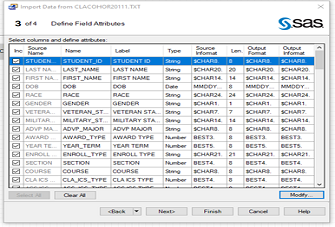
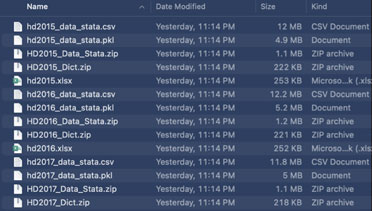
SAS Enterprise Guide: Reading, Importing, and Appending Multiple Text Files
In many circumstances, different text files are created with the same formats representing different groups or time periods. When multiple text files are held in a specific location, whether they are on a server, cloud, ...Read Moreabout: SAS Enterprise Guide: Reading, Importing, and Appending Multiple Text Files -
Creating Animations in R
If you’re looking for an excuse nowadays to spend more time inside on a computer, I recommend visiting the subreddit r/dataisbeautiful. Users submit all kinds of visualizations along with details of how they were c...Read Moreabout: Creating Animations in R -
Power up Excel
Whether you're new to Excel or breathe advanced formulae, there are always shortcuts and useful features to be discovered. Have you ever wanted a distinct count in pivot tables or an easier way to format complex workbook...Read Moreabout: Power up Excel
About eAIR
Since 1987, eAIR has been the trusted newsletter for institutional researchers and data-informed leaders. Each issue brings you the latest perspectives, news, and practical resources to help you succeed in a changing higher education landscape.